What Is a Point Cloud? Formats, Software, and How It Works
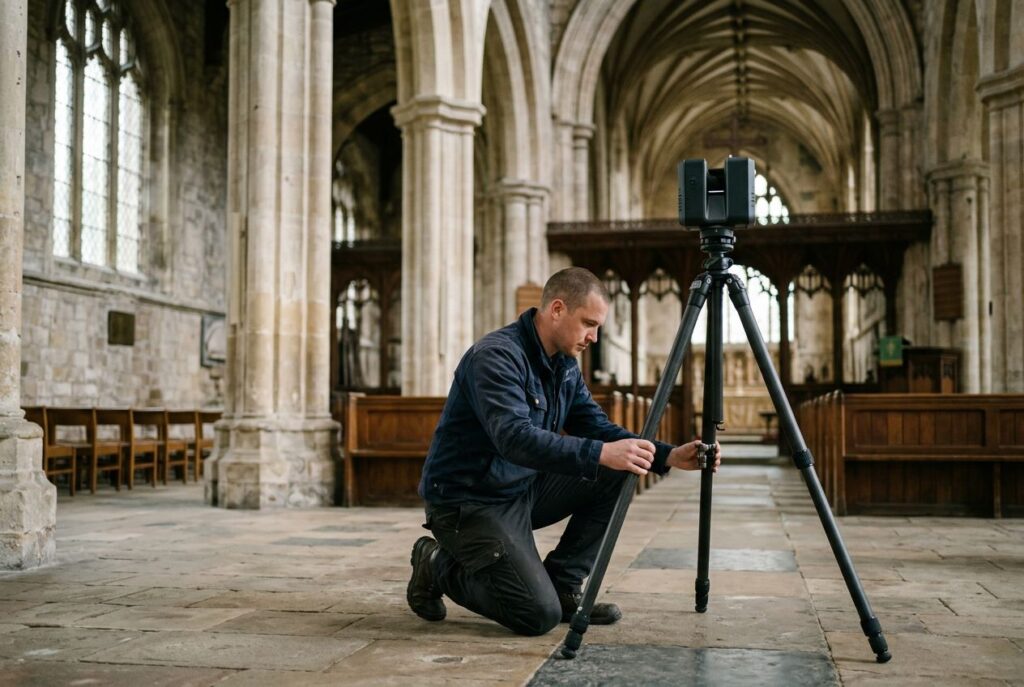
A point cloud is a set of data points in 3D space, each defined by its own X, Y, Z coordinates, that together approximate the surface of an object or environment. Point clouds are the raw output of 3D scanning: a LiDAR sensor, a photogrammetry pipeline, or a stereo/time-of-flight camera each measure thousands to billions of individual points, and the resulting cloud can be stored, filtered, aligned, and turned into a mesh or CAD model. This guide covers what a point cloud actually contains, the file formats used to store one, how they get processed into something usable, and the software that does it.
What is a point cloud, exactly?
A point cloud is a discrete set of data points in space, where each point has a position defined by Cartesian coordinates (X, Y, Z). Beyond position, individual points can carry additional attributes: RGB color sampled from a camera, a surface normal vector describing local orientation, an intensity value showing how reflective the surface was, and sometimes a timestamp recording exactly when that point was captured.
Point clouds are generally produced by 3D scanners or by photogrammetry software that measures many points on the external surfaces of the objects around them. On their own, the points don't describe a surface — there is no information about which points are connected to which. That is the key difference between a point cloud and a mesh: a mesh adds faces (usually triangles) that stitch points together into a continuous surface, while a raw point cloud is just the samples.
A point cloud can be organized or unorganized. An organized point cloud keeps the row/column structure of the sensor that captured it — this is typical of data from stereo cameras or time-of-flight cameras, where each point corresponds to a pixel — which makes it much faster to find a point's neighbors. An unorganized point cloud is just a flat list of points with no implied structure, which is what most LiDAR and photogrammetry pipelines output after merging multiple scans.
How point clouds are produced
Three capture methods dominate:
- LiDAR: a laser rangefinder measures the time it takes a pulse of light to bounce off a surface and return, converting that time-of-flight into a distance. Sweeping the beam across a scene builds up a dense cloud of ranged points, each with an intensity value describing the reflectivity of what it hit. See our guide to LiDAR sensors for how the different scanning architectures work.
- Photogrammetry: software reconstructs 3D geometry from overlapping 2D photographs, triangulating the position of matching features across images to estimate depth. This produces point clouds with natural RGB color already attached, since the source is ordinary photos, but it depends on good lighting and enough visual texture to find matches — it struggles on blank walls, water, or reflective surfaces.
- Stereo and time-of-flight (ToF) cameras: stereo cameras infer depth by comparing the same scene from two lenses, the way human binocular vision works; ToF cameras measure the same time-of-flight principle as LiDAR but with a modulated light source covering the whole frame at once rather than a scanned beam. Both typically output an organized point cloud aligned to the camera's pixel grid. Our time-of-flight sensor guide covers the direct (dToF) and indirect (iToF) variants in detail.
These methods aren't mutually exclusive, and the choice between the two most common ones — LiDAR and photogrammetry — comes down to accuracy, cost, and how the scene is lit; we cover that trade-off directly in photogrammetry vs LiDAR rather than repeating it here. One more source worth knowing: newer 4D imaging radar units also output a sparse point cloud by adding elevation to the traditional range/azimuth/velocity measurement, which we cover in our mmWave radar guide.
Point cloud file formats
Because point clouds come from many different industries — surveying, robotics, cultural heritage, manufacturing — no single file format dominates. Four show up constantly:
| Format | Origin | Structure | Best for |
|---|---|---|---|
| LAS / LAZ | Developed by ASPRS (American Society for Photogrammetry and Remote Sensing) for LiDAR data, geared toward aerial and terrestrial surveying | Fixed-size binary records with a defined set of fields per point; LAZ is a lossless compressed version of LAS | Aerial and terrestrial LiDAR, GIS and surveying workflows |
| PLY | Created at Stanford University (Greg Turk, 1994) as the "Stanford Triangle Format" | ASCII or binary; stores a list of vertex elements and, optionally, face elements connecting them into a mesh | 3D scanning of individual objects, computer graphics, cultural heritage capture |
| PCD | Native format of the Point Cloud Library (PCL) | ASCII, binary, or binary-compressed; header explicitly declares fields, dimensions, and whether the cloud is organized | Robotics and computer-vision pipelines already using PCL |
| E57 | ASTM International standard (E2807), developed for vendor-neutral exchange between laser scanner software | Hierarchical structure mixing XML metadata with efficient binary point/image data; supports Cartesian or spherical coordinates and embedded photos | Moving scans between different terrestrial laser scanner vendors and CAD/BIM software |
LAS is the more rigid of the two LiDAR-oriented formats: it uses a pre-defined set of fixed-size record types built for aerial data collection. E57 was designed later specifically to be more flexible, letting each point carry a custom set of fields and supporting an effectively unlimited file size, where LAS is capped at roughly 4.2 billion records per file. The trade-off is that LAS is simpler and near-universally supported in surveying software, while E57 needs a compliant reader to unpack its richer structure.
Raw LAS files get large fast — a single flight can produce gigabytes of data — which is why LAZ exists. LAZ is a lossless compression of LAS pioneered by the open-source LASzip library: it typically shrinks a LAS file to 7-20% of its original size while decompressing back to a bit-identical copy, and most LiDAR software can read LAZ directly without a separate decompression step.
PCD deliberately does not try to replace PLY, LAS, or OBJ; it exists because PCL needed a format that could natively flag whether a cloud is organized (has a fixed width and height, like the output of a stereo or ToF camera) or unorganized, something none of the older formats were designed to express.
How point clouds are processed
A raw point cloud almost never goes straight into an application. A typical pipeline runs through some or all of these steps:
Registration (alignment)
A single scan only covers what the sensor could see from one position, so multiple scans have to be stitched into one coordinate system — a process called point set registration. The standard algorithm is Iterative Closest Point (ICP), which aligns two overlapping point clouds separated by a rigid transform by repeatedly matching nearest points and refining the transform until it converges. Variants exist for non-rigid alignment (NICP) and for clouds that also carry color (colored ICP), and newer approaches use end-to-end neural networks to register clouds directly.
Filtering and downsampling
Raw scans carry noise, outlier points, and often far more density than a downstream task needs. Voxel downsampling buckets points into a 3D grid and replaces every occupied cell with a single averaged point, cutting the cloud size while keeping its overall shape — a common pre-processing step before registration or feature estimation. Outlier removal filters drop points that sit too far from their neighbors, which is typically scanner noise rather than real geometry.
Segmentation
Segmentation splits a cloud into meaningful subsets. Plane segmentation, usually done with RANSAC, finds the flat surface with the largest support in the cloud (a floor, a wall, a tabletop) by repeatedly sampling a small set of points, fitting a plane, and counting how many other points fall within a distance threshold of it. Clustering algorithms such as DBSCAN group the remaining points into distinct objects based on local density, which is how a scan of a room gets separated into "floor," "wall," and individual pieces of furniture without any manual labeling.
Meshing (surface reconstruction)
Point clouds can be rendered and inspected directly, but most downstream uses — CAD, 3D printing, visualization — need a continuous surface. Surface reconstruction techniques convert a cloud into a polygon mesh: Delaunay triangulation, alpha shapes, and ball pivoting build a network of triangles directly over existing points, while other methods convert the cloud into a volumetric distance field and extract a surface from it with a marching cubes algorithm. Which technique works best depends heavily on how uniform and noise-free the input cloud already is — meshing amplifies whatever registration and filtering left behind.
Software and libraries for working with point clouds
Two open-source libraries anchor most point cloud development:
- Point Cloud Library (PCL): a BSD-licensed C++ library organized into modules for filtering, feature extraction, keypoints, registration, k-d trees, octrees, segmentation, sample consensus (RANSAC-family algorithms), surface reconstruction, and visualization. It is the library that defined the PCD format described above.
- Open3D: a newer library with both C++ and Python interfaces, covering the same core operations — voxel downsampling, normal estimation, ICP and colored ICP registration, RANSAC plane segmentation, DBSCAN clustering, convex hulls, and mesh reconstruction — with a strong focus on ease of use and built-in visualization.
Beyond the two processing libraries, a few other tools show up constantly: CloudCompare and MeshLab are free, GUI-based applications for viewing, editing, and converting point clouds without writing code, and both read and write most of the formats above. On the commercial side, laser-scanning vendors ship their own registration and modeling suites (Leica Cyclone, FARO SCENE, Trimble RealWorks), and CAD platforms increasingly import point clouds directly as a modeling reference layer rather than requiring a separate conversion step first.
Common uses of point clouds
- Surveying and mapping: airborne and terrestrial LiDAR builds digital elevation models and as-built maps of terrain, buildings, and infrastructure at survey-grade precision.
- Construction and BIM: a scan of an existing building becomes a "scan-to-BIM" reference model, letting architects and engineers design retrofits against as-built reality instead of outdated drawings.
- Robotics and autonomous vehicles: LiDAR and 4D radar point clouds feed obstacle detection, localization, and mapping (SLAM), typically combined with camera and IMU data in a sensor fusion pipeline so no single sensor's blind spots become the system's blind spots.
- Industrial metrology and quality inspection: a manufactured part's point cloud is registered against its CAD model to measure deviation, extract geometric dimensions and tolerances, and flag defects.
- Cultural heritage and archaeology: terrestrial scanning and photogrammetry preserve digital records of at-risk sites and artifacts; airborne LiDAR can penetrate vegetation gaps to reveal terrain and structures hidden under forest canopy.
- Machine learning training data: autonomous-driving and robotics datasets are built from labeled LiDAR point clouds, where each object in a scene gets a 3D bounding box or per-point class label — a task covered in more depth in our guide to data annotation tools.
Frequently asked questions about point clouds
What is a point cloud used for?
Point clouds are used anywhere a physical space or object needs to be captured digitally in 3D: surveying and mapping, construction and BIM, industrial quality inspection, cultural heritage preservation, and as the core sensor input for robotics and autonomous vehicle perception systems.
Is point cloud software free?
Both free and paid options exist side by side. PCL, Open3D, CloudCompare, and MeshLab are open-source and free to use. Commercial options — laser-scanning vendor suites and CAD platforms with point cloud import — are typically sold under seat-based or subscription licensing; check each vendor's official pricing page for current terms, since licensing models change.
How much does point cloud software cost?
It depends entirely on the tool: the open-source libraries and viewers above cost nothing, while professional laser-scanning and CAD suites are commercial products sold under their own licensing models (perpetual, subscription, or seat-based). This piece does not quote prices for commercial software, since they change and vary by region and license tier — see each vendor's pricing page for current numbers.
What is the difference between LiDAR and point cloud data?
LiDAR is a sensing technology; a point cloud is a data structure. LiDAR is one of several ways to produce a point cloud (alongside photogrammetry and stereo/ToF cameras), and it happens to be the method that most commonly gets called "point cloud data" because dense laser scans are the most common source. See our LiDAR sensors guide for how the sensor itself works.
What software opens a point cloud file?
For quick viewing without coding, CloudCompare and MeshLab open most common formats (LAS/LAZ, PLY, PCD, E57) for free. For programmatic processing, PCL (C++) and Open3D (C++/Python) are the two most widely used libraries, and both can read and write across those same formats.
Want the bigger picture? Start with our pillar guide, What is sensor fusion? A complete guide, then see how point clouds compare to camera-based capture in photogrammetry vs LiDAR.
Recommended: